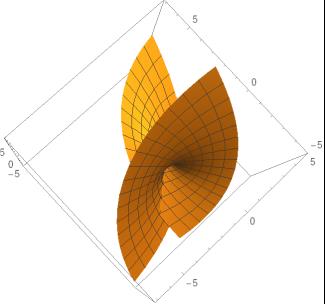
Representación gráfica de las funciones complejas con el Mathematica
DOI:
https://doi.org/10.33017/RevECIPeru2015.0008/Keywords:
complex function, visualization, submersionAbstract
The graphical display of complex-valued functions of a complex variable is a subject of much interest since the graph of such a function would have to be drawn in a four-dimensional space. This article presents a proposal to display such graphs using a model based on a submersion, from four-dimensional space to three-dimensional space; then, with the help of Mathematica arrive at a representation of the graphs mentioned in a 2D screen. Additionally, some commands are implemented in Mathematica, the same that will make representations varied and interesting examples.

Downloads
Published
2018-12-22
Issue
Section
ARTÍCULOS ORIGINALES

